What does the size of an object really mean in Java? The usual answer of counting the flat or shallow size may not always be what we are looking for. Say, we are vending out a lot of data from our application to an external application and in the process if we happen to die with an OOME, it suddenly becomes relevant to know the size of the overall data we are vending out. Here is where I stumbled on the concept called "retained size".
From YourKit's site:
The site gives a good pictorial representation that distinguishes the two. Now, YourKit is a commerical third party software. For us mere mortals, we will have to make do with JVisualVM. So I fired up my jvisualvm to perform a heap dump. Note that memory related operations using jvisualvm need to be done on the same host as the process and cannot be done remotely. Once the heap dump was done, take a deep breath and hit the "Find 20 biggest objects by retained size" button and leave for the day :)

If you are lucky, jvisualvm would have been done computing the retained size for the heap dump by the time you are back the next day. I was trying this out for a heap of size 1.3G and it didn't complete even after consuming ~75 hours of CPU time. Similar complaints are heard in forums.
Next stop: YourKit Java Profiler 11.0.8. I got an evaluation licence valid for 15 days and proceeded to download the profiler tar (~68 MB) for Linux. I loaded the snapshot taken from jvisualvm into this and in a few seconds, the snapshot loading action was done. There was a question on CompressedOops in the 64-bit JVM which was best explained in detail here.
The default view itself shows the number of objects, the shallow size and the retained size upfront. It uses some heuristics to guess these sizes and you have the option of getting the exact values by hitting another button which refines them to the more accurate values. Interestingly, these differed only minutely.

Right click on one of the culprits and you know all the retained instances. It has a few other inspections that can be done. E.g.: Duplicate strings caused by careless use of new String(), duplicate arrays, sparse arrays, zero length arrays and other oddities along with a brief explanation.

Overall the responsiveness seemed much better than jvisualvm. If anyone has used jprofiler, you can share if such a thing exists there and how intuitive/responsive it is.
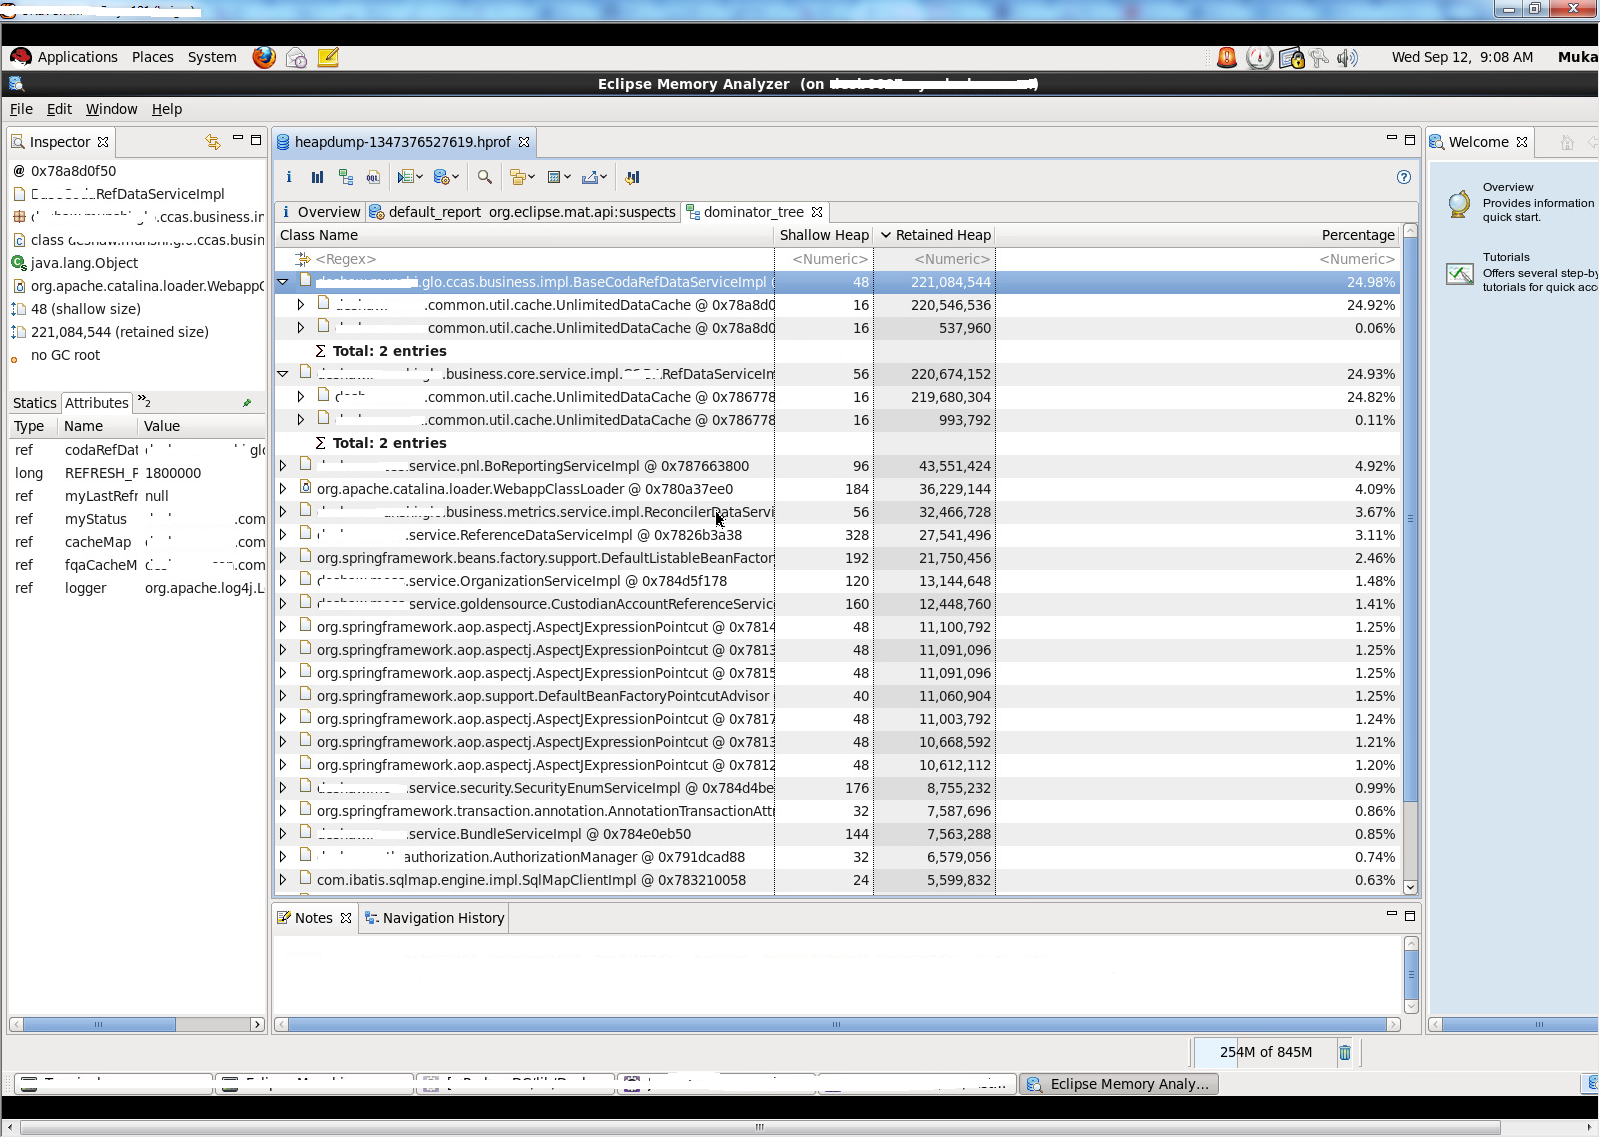
Now, over to MAT from Eclipse. This is a free tool, which is purportedly as fast as YourKit. So I dowloaded the Linux archive (~46 MB) and fired it up for the heap generated earlier.

Again, in a couple of minutes, MAT was able to create an overview which gave the biggest objects by retained sizes.


References:
From YourKit's site:
Shallow size of an object is the amount of memory allocated to store the object itself, not taking into account the referenced objects. Shallow size of a regular (non-array) object depends on the number and types of its fields. Shallow size of an array depends on the array length and the type of its elements (objects, primitive types). Shallow size of a set of objects represents the sum of shallow sizes of all objects in the set.
Retained size of an object is its shallow size plus the shallow sizes of the objects that are accessible, directly or indirectly, only from this object. In other words, the retained size represents the amount of memory that will be freed by the garbage collector when this object is collected.
The site gives a good pictorial representation that distinguishes the two. Now, YourKit is a commerical third party software. For us mere mortals, we will have to make do with JVisualVM. So I fired up my jvisualvm to perform a heap dump. Note that memory related operations using jvisualvm need to be done on the same host as the process and cannot be done remotely. Once the heap dump was done, take a deep breath and hit the "Find 20 biggest objects by retained size" button and leave for the day :)

If you are lucky, jvisualvm would have been done computing the retained size for the heap dump by the time you are back the next day. I was trying this out for a heap of size 1.3G and it didn't complete even after consuming ~75 hours of CPU time. Similar complaints are heard in forums.
Next stop: YourKit Java Profiler 11.0.8. I got an evaluation licence valid for 15 days and proceeded to download the profiler tar (~68 MB) for Linux. I loaded the snapshot taken from jvisualvm into this and in a few seconds, the snapshot loading action was done. There was a question on CompressedOops in the 64-bit JVM which was best explained in detail here.
The default view itself shows the number of objects, the shallow size and the retained size upfront. It uses some heuristics to guess these sizes and you have the option of getting the exact values by hitting another button which refines them to the more accurate values. Interestingly, these differed only minutely.

Right click on one of the culprits and you know all the retained instances. It has a few other inspections that can be done. E.g.: Duplicate strings caused by careless use of new String(), duplicate arrays, sparse arrays, zero length arrays and other oddities along with a brief explanation.

Overall the responsiveness seemed much better than jvisualvm. If anyone has used jprofiler, you can share if such a thing exists there and how intuitive/responsive it is.
Now, over to MAT from Eclipse. This is a free tool, which is purportedly as fast as YourKit. So I dowloaded the Linux archive (~46 MB) and fired it up for the heap generated earlier.

Again, in a couple of minutes, MAT was able to create an overview which gave the biggest objects by retained sizes.


References:
No comments:
Post a Comment